There was a time when working with data meant writing code. Python, SQL, R—if you couldn't program, you couldn't analyze. That created a bottleneck: business teams with questions had to wait for technical teams to find answers.
Not anymore. The rise of no-code data analysis tools has democratized data, putting powerful analytical capabilities in the hands of anyone who can click a mouse.
What is No-Code Data Analysis?
No-code data analysis refers to the use of visual, drag-and-drop tools that allow users to clean, transform, analyze, and visualize data without writing any programming code.
Instead of writing df.groupby('category').mean(), you simply click "Group By" and select your column. The tool handles the technical complexity behind the scenes.
🎯 The Goal:
Enable anyone—marketers, sales reps, operations managers, HR professionals—to extract insights from data independently, without relying on data scientists or developers.
Why No-Code Data Analysis Matters
1. Speed to Insight
When business users can analyze data themselves, insights come faster. No waiting in a queue for the data team. No back-and-forth explaining requirements. You have a question? Answer it yourself in minutes.
2. Empowered Decision Making
Data-driven decisions shouldn't be limited to those who can code. When everyone can access and analyze data, better decisions happen at every level of the organization.
3. Reduced IT Bottlenecks
Data teams are perpetually overwhelmed. No-code tools free them to focus on complex problems while business users handle routine analysis independently.
4. Lower Costs
Training someone to use a no-code tool takes hours. Training someone to code takes months. The ROI is clear.
What Can You Do Without Code?
Modern no-code platforms support surprisingly sophisticated operations:
| Task | No-Code Capability |
|---|---|
| Data Cleaning | Remove duplicates, fix formats, handle missing values |
| Data Transformation | Filter, sort, group, pivot, merge datasets |
| Data Profiling | Automatic statistics, distributions, quality metrics |
| Visualization | Charts, dashboards, interactive reports |
| Basic Analytics | Aggregations, trends, comparisons, forecasting |
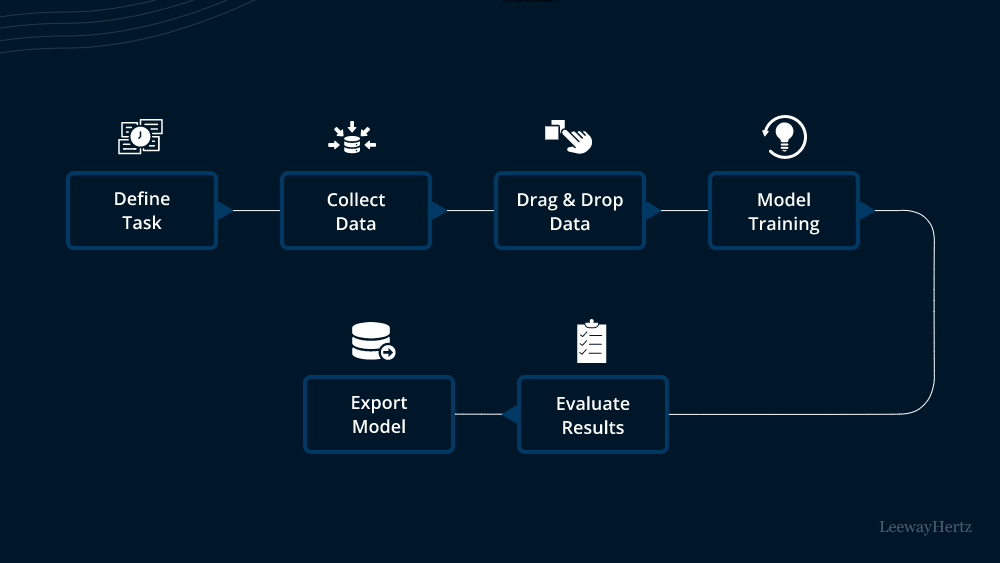
Getting Started: A Practical Guide
Step 1: Define Your Question
Start with a clear business question. "What were our top-selling products last quarter?" is better than "I want to look at sales data."
Step 2: Gather Your Data
Export data from your systems:
- CRM exports (Salesforce, HubSpot)
- Spreadsheets (Excel, Google Sheets)
- Database exports (CSV files)
- Marketing platforms (Google Analytics, social media)
Step 3: Upload and Profile
Load your data into a no-code tool. Start with profiling to understand what you're working with—column types, missing values, distributions.
Step 4: Clean and Transform
Address data quality issues:
- Remove or fix invalid entries
- Standardize formats
- Handle missing values
- Create calculated fields if needed
Step 5: Analyze and Visualize
Apply filters, groupings, and aggregations to answer your question. Create visualizations to communicate findings.
Step 6: Share Insights
Export your findings as reports, dashboards, or cleaned datasets for further use.
💡 Real Example:
A marketing manager wants to know which email campaigns drove the most conversions. Using SubDivide, they upload campaign data, filter by date range, group by campaign name, and instantly see conversion totals. Total time: 5 minutes. No code written.
Best Practices for Non-Technical Users
✅ Start Small
Don't try to analyze everything at once. Pick one question, one dataset, and master that before expanding.
✅ Validate Your Results
Sanity-check your findings. Does the total revenue match what finance reports? Do the customer counts seem reasonable?
✅ Document Your Process
Keep notes on what you did. This helps with reproducibility and explaining your methodology to others.
✅ Know Your Limits
No-code tools are powerful but not unlimited. For complex statistical modeling or machine learning, you may still need technical help.
✅ Collaborate with Data Teams
Use no-code tools to do initial exploration, then partner with data professionals for deeper analysis when needed.
Choosing the Right No-Code Tool
Look for these features:
- Intuitive interface: If it requires training to understand, it's not truly no-code
- Data profiling: Automatic insights into data quality
- Flexible import/export: Support for common formats (CSV, Excel)
- Cleaning capabilities: Built-in tools for common data issues
- Scalability: Can it handle your data volume?
- Collaboration features: Share results with teammates
🏆 Why SubDivide:
SubDivide was built specifically for non-technical users who need to work with data. One-click profiling, visual data cleaning, and instant exploratory analysis—all without writing a single line of code.
Conclusion
The democratization of data analysis is one of the most significant trends in modern business. No-code tools break down barriers, enabling faster decisions, empowered teams, and better outcomes.
You don't need to be a data scientist to be data-driven. With the right tools, anyone can transform raw data into actionable insights.
✅ Ready to analyze data without code?
Try SubDivide — the no-code platform that makes data cleaning, profiling, and analysis accessible to everyone.